 |
Sarah
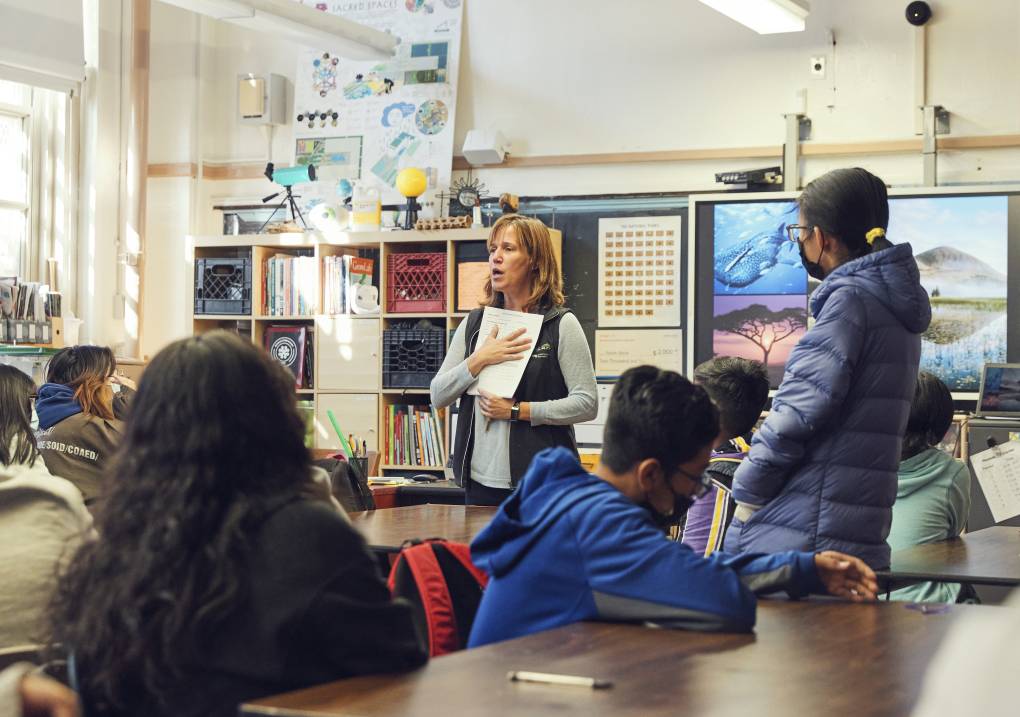
Slack, an eighth grade science teacher at J.H.S. 223 The Montauk in
Brooklyn, explains to her students how to collect temperature data on
their school playground. (Mohamed Sadek for NPR) |
"Take a look over your data sheet and make sure you know what all the words mean," Sarah Slack tells her class of eighth graders. The students stop talking to each other and turn toward their science teacher, who is standing in front of a digital blackboard holding up a sample data sheet. "We're going to be not only collecting temperatures in the sun and in the shade, but you're going to choose some words to describe the weather."
Slack's students do a lot of hands-on science. Inside their Brooklyn, N.Y. junior high school, J.H.S. 223, she's built a lab that is a small ecosystem itself. On one end of the room hydroponic gardens spritz water over patches of arugula, kale, cucumbers, peppers, and tomatoes, the grow lights casting a bright white glow across the room. In a back corner, tiny baby trout swim in a bubbling aquarium, the filter humming quietly. And on Slack's desk common mollies, another small fish, dart around a tank with basil growing out of the top. Each nourishes the other in a symbiotic cycle.
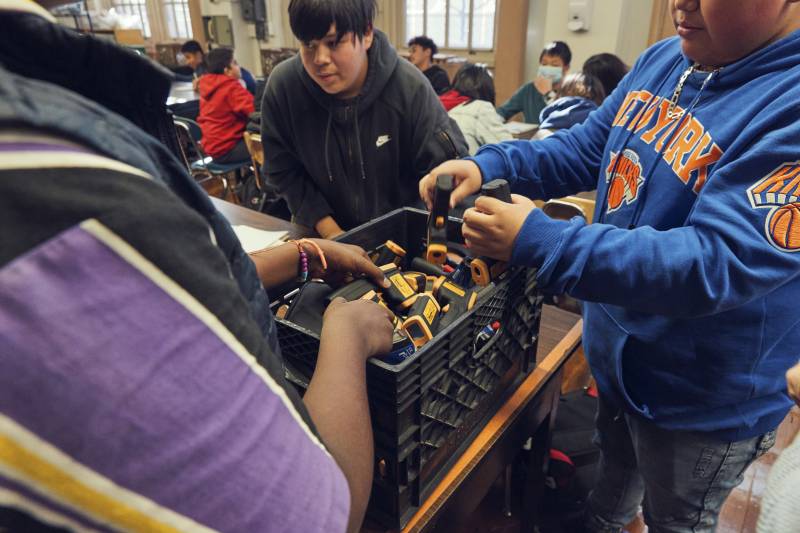
But on this early November day, the school playground will serve as the students' lab. "I think we're ready, everybody," Slack says, opening the classroom door. "You're going to need to bring three things with you – something to write with, your notebook, and you're going to need an infrared surface thermometer."
The students surround a milk crate at the center of the room to grab handheld thermometers, which they quickly begin testing on everything around them – the desks, the chairs and their bodies – before following their teacher out the door.
 |
She'll upload the measurements these students collect from playground surfaces to a database made available to climate scientists through NASA. Slack aims to help her eighth graders understand climate change and also how to use science to mitigate the tangible impacts of the warming world. Especially right here at their school and in their neighborhood.
Students measure surface temps in the schoolyard
Slack reminds them what surface temperatures they'll be investigating. "We're measuring pavement, concrete, dirt and grass. Which one of these is going to be the hardest to find out there?" she asks.
It's an easy question. "Grass," several students mutter at once.
The playground they're heading toward is similar to many in New York and other urban areas. It's made of – and surrounded by – asphalt and concrete, materials that heat up quickly but cool off slowly.
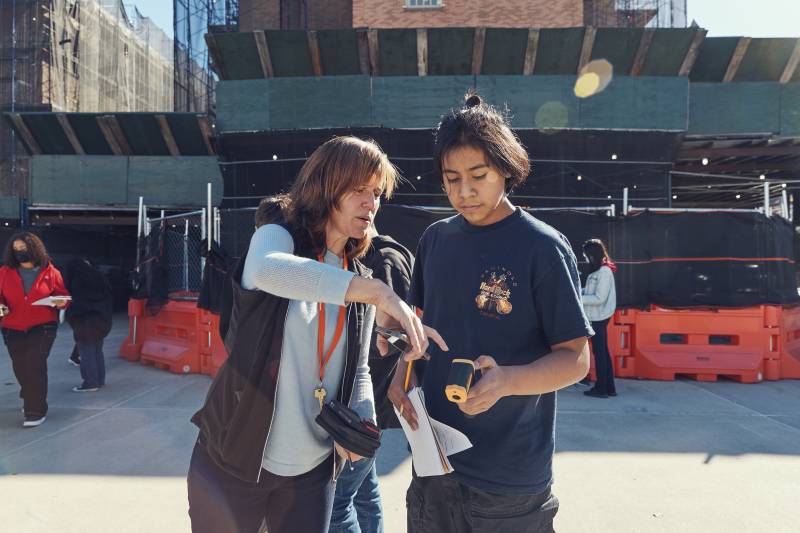
To get there, the students have to go through a tunnel of metal construction scaffolding that surrounds their school. Some run and skip; others amble slowly, gossiping with friends. They all spill out onto a wide open blacktop. The only plant life here is a handful of spindly trees, leaves brown and falling, spaced out along the playground's perimeter in small dirt plots.
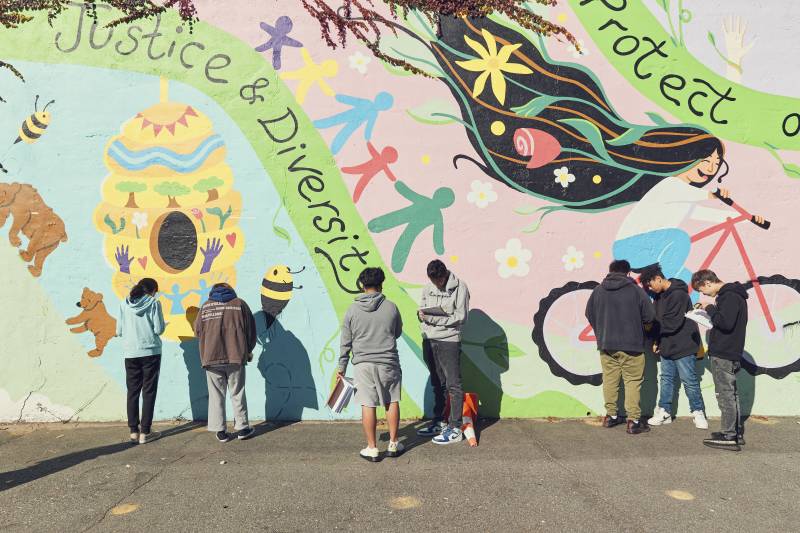
Students split up to take surface temperatures of different materials in the yard. Most scurry around the asphalt pavement, pointing their thermometers toward the ground. Others start collecting temperature data from the small dirt patches under the trees, trying to find both sunny and shady spots to measure. A handful of students head for a bright, colorful mural painted on a concrete wall that serves as one of the borders of the playground.

One eighth grader, Li Qing, wearing pastel pink sweats and puffy lavender jacket, points her handheld thermometer at part of the large mural. "It's technically hotter than the dirt," she notes. "I guess the cement absorbs more heat, or something," she thinks out loud.
She points her thermometer at a flower painted in the mural.
"The white one is only 70 degrees," she says, before pivoting to a part of the mural inches away, showing a black bicycle tire.
"Oh my God. 89!" she says.
In short order, most students had measured and recorded temperatures of three of the four surfaces Slack asked them to measure.
Just one left to find. Grass.
Urban schools can be neighborhood hot spots
This hard surface playground is tucked between the four-story brick school building on one side and the concrete wall of a New York townhouse – with the mural – on another. Two tall chain link fences edge the rest of the playground. Through the metal links, blacktop streets lined with brick houses stretch as far as the eye can see.
City data ranks this neighborhood, Borough Park, high on its "heat vulnerability" index, which shows the relative impact of extreme heat events, such as deaths, on different communities. Surface temperatures are one big indicator of risk, and as Slack's students discover, the materials surrounding their school – asphalt and concrete – get hot.
When scientists look at a bunch of neighborhoods like Borough Park together, they see what's called an "urban heat island" – places where urban centers are significantly warmer than their suburban and rural neighbors. Within cities, different neighborhoods, blocks and even buildings can have different surface temperatures.
Historic inequity plays a significant role: neighborhoods that have long been low-income and majority people of color often lack parks, lush green lawns and trees that can help cool off a neighborhood.
"Formerly redlined neighborhoods are also those that tend to have fewer trees, and also more heat so that those patterns all connect to environmental justice issues," Slack says.
Borough Park has a long immigrant history and high rates of poverty and renters compared to the average in New York City. The two parks nearest J.H.S 223 are both a five minute walk from the school. Although they provide some shade and greenery, they are also part of the urban infrastructure, with leafy trees tucked around paved play areas. One park is right next to an elevated train line.

The data from their school yard might contribute to doing both.
Students' measurements help fill gaps in global data
The official temperature for Borough Park the fall day Slack's students did this outdoor lab was an unseasonably warm 68 degrees. Around the playground, students clocked temperatures lower and much higher than that.
"53 point 6," one student reported to Slack, measuring the pavement in the shade of the school building.
"Hold up, I got 79," another student told her group of friends as they stood in a circle in the sun comparing readings. "I got 81," one of her friends responded, pointing her thermometer toward her feet on the hot asphalt.
One patch of the playground asphalt pavement isn't black. It's has a grid of six circles, each a different color of the rainbow. Two years ago, Slack and her students painted this, as a way to test what a completely different schoolyard might feel like – a playground that was yellow, or blue, or purple instead of black. "We measure the temperature there to see what would happen if we painted the whole yard a color," Slack says.


